netviz

802.11 · WiFi

How the Wi-Fi signal travels frequency, walls & multipath

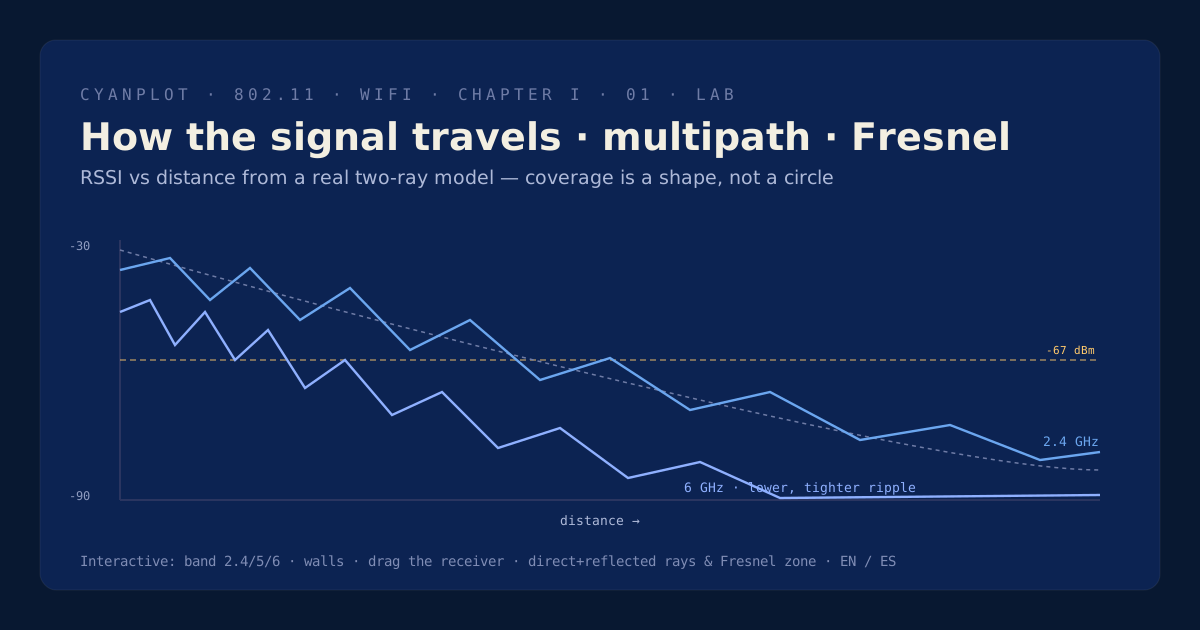
Radio doesn't travel in a tidy circle — it fades with distance, bounces off floors and walls, and soaks into materials differently by frequency. This lab plots RSSI vs distance from a real two-ray model, so you can watch coverage's true, rippling shape as you change band, add a wall, and move the receiver.

Sequence diagram poster of the WPA2 4-way handshake

Requesting scene from the content service…

~8.5 dB
6 GHz starts behind 2.4
two-ray
ground-reflection model
free-space path lossFresnel zonemultipathfading nulls

What you'll learn

  • Why free-space loss grows with both distance and frequency — 6 GHz starts ~8.5 dB behind 2.4 GHz.
  • How the two-ray (direct + ground-reflected) model produces constructive peaks and deep fading nulls.
  • Why walls cost the higher bands more, making 6 GHz a same-room, short-hop band.
  • What the Fresnel zone is, and why a single fixed measurement can sit in a null and lie to you.

Coverage is a shape, not a circle

Three effects stack to make the real coverage curve. Free-space path loss grows as 20·log10(distance) + 20·log10(frequency), so before anything else a 6 GHz link starts several dB behind 2.4 GHz at the same range. The two-ray ground-reflection model adds a floor-bounced ray whose phase difference with the direct ray (set by the wavelength) creates constructive peaks and deep fading nulls — the ripples you see as you move. Material loss compounds on top and rises with frequency.

This lab makes all three tangible: choose a band, add a wall material, and slide a receiver along an RSSI-vs-distance plot drawn from the actual model, with a side-view of the direct and reflected rays and the Fresnel zone. It's the intuition behind every survey — pick the band for the job, design to a margin above threshold, and never trust 'good bars' at a single spot, because multipath guarantees a null is nearby.

Atlas index