netviz

802.11 · WiFi

Wi-Fi RF Lab cell overlap, live

Every Wi-Fi design argument — more APs? more power? — comes down to one tension: cells must overlap enough to roam, but not so much that they shout over each other. This lab puts that tension under your fingers.

Sequence diagram poster of the WPA2 4-way handshake

Requesting scene from the content service…

−67 dBm
at the cell edge
10–25%
overlap sweet spot
7 APs
honeycomb floor
co-channel interferencechannels 1/6/11roaming corridorsticky clients

What you'll learn

  • Why 10–25% cell overlap is the design sweet spot — and what breaks on either side of it.
  • How the 2.4 GHz band's three usable channels (1/6/11) force co-channel neighbors, and how 5 GHz absorbs the same geometry.
  • How RSSI falls with distance (log-distance model, -67 dBm at the cell edge) and what each signal tier means operationally.
  • Why adding APs or raising power often makes a floor SLOWER — co-channel cells share one airtime domain.
  • What a roaming corridor is, why sticky clients happen, and what minimum-power fixes actually do.

A laboratory, not a diagram

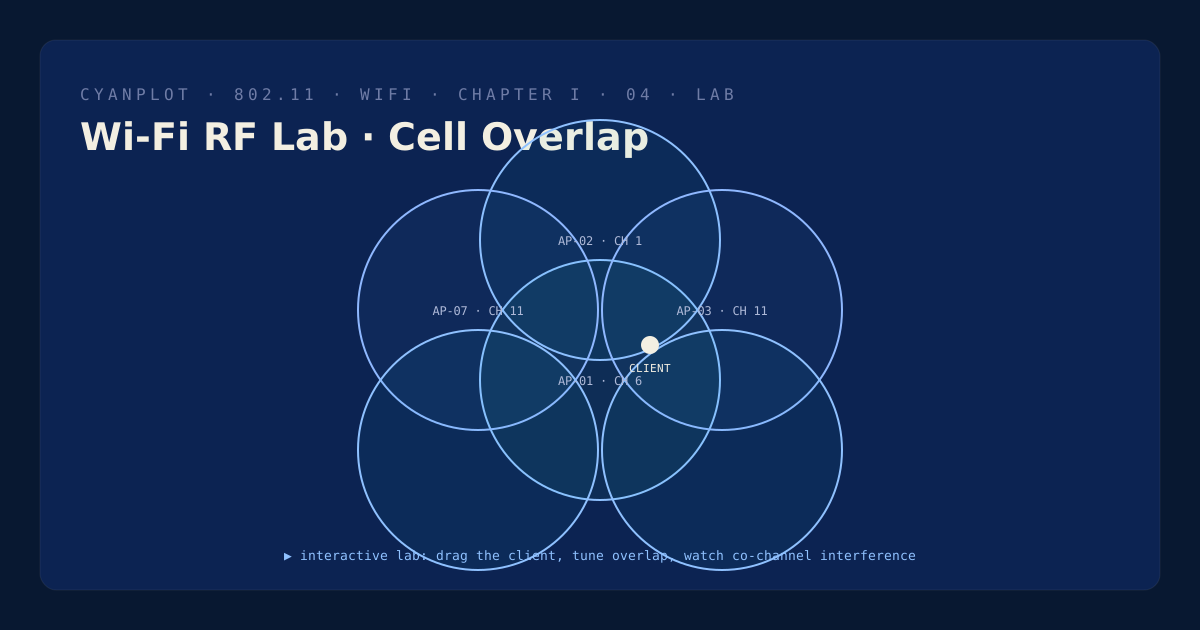
Sequence plates replay a conversation; this plate hands you the instruments. Seven access points cover a floor in a honeycomb. Two sliders — AP spacing and cell radius — and a band switch control the geometry. A draggable client measures what it hears from every AP, ranked by signal, exactly the way a real device chooses where to associate.

The verdict updates as you move: too little overlap and roaming drops mid-corridor; the healthy band sustains seamless handoffs; push further and same-channel cells begin to hear each other, serializing their airtime until full signal bars deliver empty throughput.

The demo that wins design arguments

“Just add another AP” and “turn the power up” are the two most expensive sentences in wireless networking. This lab exists to show — not tell — why: thirty seconds of dragging sliders makes co-channel interference visible in a way no static diagram can.

Three narration depths follow the interaction: a plain reading of what the user would feel, the engineering account in dBm and duty cycles, and the operations view with the fixes that actually work.

Atlas index