Nine numbers, one curve
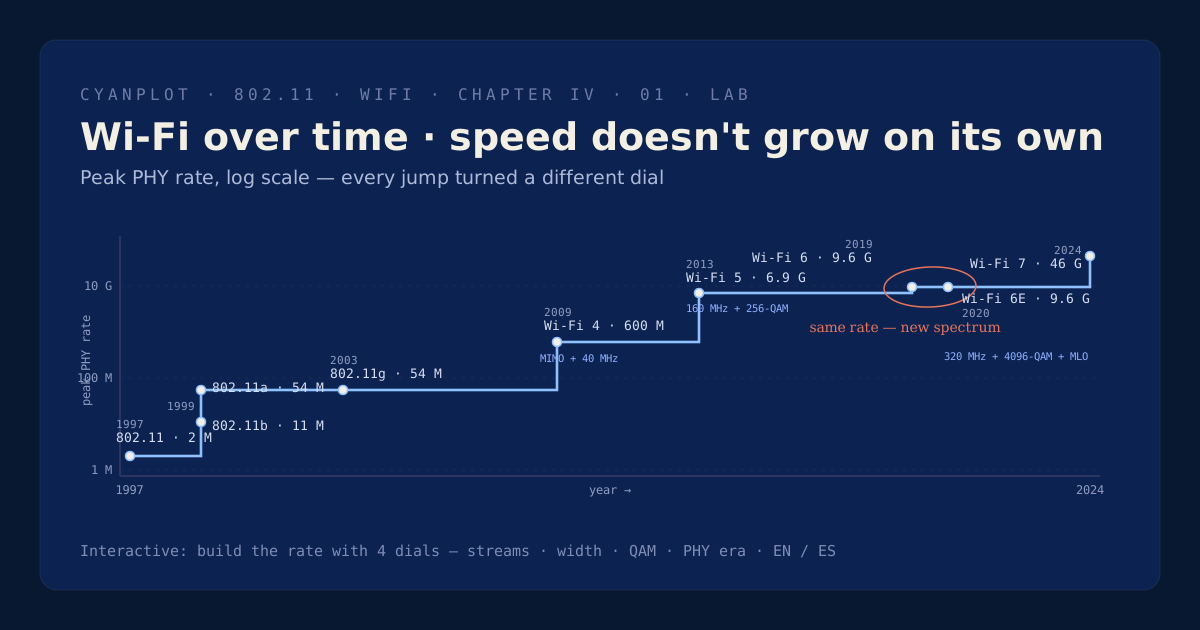
Every Wi-Fi generation since 1997 has shipped with a bigger peak-rate number: 2 Mbps, then 11, then 54, then 600 million, then billions. Plotted on a linear axis the early jumps vanish into a flat line at the bottom. Plotted on a log scale, the whole 27-year climb becomes one legible curve — and the story stops being 'Wi-Fi got faster' and starts being 'here is exactly which lever moved, and when.'
These are peak theoretical PHY rates — the maximum a lab can coax out of the top-shelf configuration, not what your phone gets in the kitchen. That's deliberate: the point of this timeline isn't your speedometer, it's the shape of each jump.